

Design Quality Tools


We use quality tools in design to make sure a product or service meets customer needs before it is produced.
They help designers to:
- Understand customer requirements.
- Identify possible design problems early.
- Compare different design ideas.
- Find the root causes of weaknesses.
- Reduce defects, risks, costs, and waste.
- Test whether the design meets specifications.
- Improve reliability, safety, and usability.
The design quality tools are:
1.Design Risk Analysis
2.Quality Function Deployment (QFD)
3.Design Failure Mode and Effects Analysis (DFMEA)
4.Design for Six Sigma (DFSS)
5.Design of Experiments (DOE)
6.Fault Tree Analysis (FTA)
7.Reliability analysis
8.Tolerance analysis
9.Design for asambly
10.Design for Afternarket
11.Design for Scrapping


1. Design risk analysis
A design risk analysis identifies how a design could fail, evaluates the risk, and defines actions to prevent failure. A common method is Design Failure Mode and Effects Analysis (DFMEA).
How to perform it
A. Define the scope
Identify the product, subsystem, or component being analyzed.
Clarify its intended functions, users, operating conditions, and interfaces.
B. Build a cross-functional team
Include representatives from design, quality, manufacturing, testing,
service, safety, and suppliers when relevant.
C. Identify potential failure modes
Ask: How could each function fail?
Examples include breaking, leaking, overheating, incorrect output,
excessive wear, and unsafe operation.
D. Determine effects and causes
Effect: What happens to the user, system, or environment?
Cause: What design weakness could create the failure?
E. Evaluate each risk Assign ratings
commonly from 1 to 10, for:
Severity (S): How serious is the effect?
Occurrence (O): How likely is the cause?
Detection (D): How likely is the problem to escape detection?
A traditional risk priority number is:
RPN=S×O×D
F. Prioritize the risks
Address safety, legal, and high-severity risks first.
Do not rely only on the RPN; a severe risk requires attention even when
its occurrence is unlikely.
G. Define risk-reduction actions
Eliminate the failure mechanism through redesign.
Add design margins, stronger materials, or safeguards.
Simplify interfaces and reduce variation.
Improve simulations, calculations, inspections, and testing.
I. Implement and verify
Assign an owner and deadline for every action.
Test whether the action actually reduces the risk.
J. Reassess and document
Update the severity, occurrence, and detection ratings.
Keep the analysis current when the design, requirements, or operating
conditions change

2.Quality Function Deployment (QFD)
A design risk analysis identifies how a design could fail, evaluates the risk, and defines actions to prevent failure. A common method is Design Failure Mode and Effects Analysis (DFMEA).
How to perform it
A. Identify the customers
Determine who uses, buys, maintains, or is affected by the product.
Include internal customers and other important stakeholders.
B.Collect the Voice of the Customer
Use interviews, surveys, complaints, observations, and market research.
Write the needs in the customer's language, such as "easy to use" or
"quiet."
C.Prioritize customer needs
Give each need an importance score, for example from 1 to 5.
Consider customer satisfaction, complaints, and competitive performance.
D.Define technical requirements
Translate each customer need into measurable engineering
characteristics.
For example, translate "quiet" into a maximum noise level measured in
decibels.
E.Create the relationship matrix
Evaluate how strongly each technical requirement affects each customer
need.
A common scoring system is:
9 = strong relationship
3 = medium relationship
1 = weak relationship
Blank = no relationship
F. Analyze technical relationships
Use the roof of the House of Quality to show where technical
requirements support or conflict with each other.
For example, reducing weight might conflict with increasing strength.
G. Compare competitors
Evaluate how well your product and competing products satisfy each
customer need.
Identify weaknesses and opportunities for differentiation.
I. Calculate priorities
Multiply each customer-importance rating by its relationship score.
Add the results for every technical requirement:
〖"Technical priority" 〗_j=∑128_i▒(〖"Customer importance" 〗_i×
〖"Relationship" 〗_ij )
J. Set measurable targets
Define target values, measurement methods, responsible owners, and
completion dates for the highest-priority characteristics.
Deploy the results
Transfer the priorities into concept design, component requirements, process planning, production controls, and verification tests.
Review the QFD whenever customer needs or the design changes.
Example: If customers want a "lightweight and durable laptop," QFD could translate this into measurable requirements for total mass, drop resistance, hinge-cycle life, and material strength.

3.Design Failure Mode and Effects Analysis (DFMEA)
A design risk analysis identifies how a design could fail, evaluates the risk, and defines actions to prevent failure. A common method is Design Failure Mode and Effects Analysis (DFMEA).
How to perform it
A. Define the scope
Identify the product, subsystem, or component being analyzed.
Clarify its intended functions, users, operating conditions, and interfaces.
B. Build a cross-functional team
Include representatives from design, quality, manufacturing, testing,
service, safety, and suppliers when relevant.
C. Identify potential failure modes
Ask: How could each function fail?
Examples include breaking, leaking, overheating, incorrect output,
excessive wear, and unsafe operation.
D. Determine effects and causes
Effect: What happens to the user, system, or environment?
Cause: What design weakness could create the failure?
E. Evaluate each risk Assign ratings
commonly from 1 to 10, for:
Severity (S): How serious is the effect?
Occurrence (O): How likely is the cause?
Detection (D): How likely is the problem to escape detection?
A traditional risk priority number is:
RPN=S×O×D
F. Prioritize the risks
Address safety, legal, and high-severity risks first.
Do not rely only on the RPN; a severe risk requires attention even when
its occurrence is unlikely.
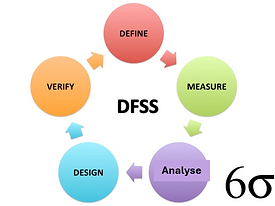
4.Design for Six Sigma (DFSS)
A.Define
Identify the customer and project scope.
Define the business case, objectives, schedule, and responsibilities.
B.Measure
Gather the Voice of the Customer.
Translate customer needs into measurable Critical-to-Quality requirements
(CTQs).
Establish target values and specifications.
C.Analyze
Develop and compare different design concepts.
Use tools such as QFD, benchmarking, risk analysis, and a decision
matrix.
Select the concept that best meets the CTQs.
D.Design
Develop the detailed product or process design.
Optimize it using DFMEA, simulations, tolerance analysis, and Design of
Experiments.
Create prototypes and a verification plan.
E. Verify
Test the final design under realistic operating conditions.
Confirm that it meets customer needs, CTQs, safety requirements, and
quality targets.
Validate the process, document the results, and transfer the design to
production.
The basic sequence is Define -> Measure -> Analyze -> Design -> Verify. Unlike DMAIC, which improves an existing process, DFSS is mainly used to create a new or substantially redesigned solution.

5.Design of Experiments (DOE)
A. Define the objective
State the problem and the result you want to improve.
Select measurable outputs, called responses.
B. Select factors and levels
Identify the input variables that may affect the response.
Choose the values to test for each factor, such as low and high
temperature.
C. Choose an experimental design
Use a full factorial design when testing every combination.
Use a fractional factorial design when many factors make a full design
impractical.
Use response-surface methods when optimizing settings or investigating
curvature.
D. Plan the experiment
Define the sample size and number of repetitions.
Randomize the run order to reduce bias.
Use blocking when known differences, such as machines or batches,
could affect the results.
Keep uncontrolled conditions as stable as possible.
E. Conduct the experiment
Follow the experimental plan consistently.
Record factor settings, responses, deviations, and observations.
F. Analyze the results
Determine which factors and interactions significantly affect the response.
Use graphical analysis, regression, or analysis of variance (ANOVA).
Check that the statistical assumptions are reasonable.
G. Select the best settings
Choose the factor combination that produces the desired performance.
Consider quality, cost, safety, and practical limitations.
H. Confirm and implement
Perform confirmation runs using the selected settings.
Compare the actual results with the predicted results.
Standardize the settings and monitor performance.
Example: To improve adhesive strength, you could test temperature, pressure, and curing time at two levels each. DOE shows which factors and combinations have the greatest effect, helping you select the best settings with fewer tests than changing one factor at a time.

6.Fault Tree Analysis (FTA)
Fault Tree Analysis is a top-down method used to identify the causes and combinations of events that could lead to an unwanted outcome.
A. Define the top event
Clearly describe the failure or hazardous event being analyzed.
Example: "The braking system fails to stop the vehicle."
B. Define the scope
Establish system boundaries, operating conditions, assumptions, and
level of detail.
C. Identify immediate causes
Determine which events could directly cause the top event.
Use drawings, specifications, test results, and expert knowledge.
D. Connect events with logic gates
OR gate: The output occurs if any input event occurs.
AND gate: The output occurs only if all input events occur together.
E. Break causes down further
Continue from intermediate events to lower-level causes until reaching
basic events that can be evaluated or controlled.
F. Review the fault tree
Check that the logic is complete and technically correct.
Review it with a cross-functional team.
G. Analyze the risks
Identify minimal cut sets, which are the smallest combinations of basic
events that can produce the top event.
If reliable failure data are available, calculate the probability of the top
event.
H. Prioritize improvements
Focus on high-consequence events, single points of failure, common
causes, and likely combinations.
Introduce redundancy, monitoring, safeguards, design changes, or
preventive maintenance.
I. Verify and update
Confirm that the actions reduce the risk.
Update the fault tree whenever the design, operating conditions, or
failure data change.
Example: A machine may overheat because the cooling fan fails OR airflow is blocked. The fan may fail because both electrical power is lost AND the backup supply does not operate.

7.Reliability analysis
A reliability analysis evaluates whether a product or system will perform its required function for a specified time under stated conditions.
A. Define the requirements
Specify the function, operating conditions, required lifetime, and
acceptable failure rate.
Define measurable targets such as reliability, availability, or mean time
between failures.
B. Define the system
Break the system into components and identify their functions, interfaces,
and dependencies.
Determine whether components operate in series, parallel, or with
redundancy.
C. Identify potential failures
Use field data, previous designs, DFMEA, Fault Tree Analysis, and expert
knowledge.
Identify failure modes, causes, effects, and failure mechanisms.
D. Collect reliability data
Use supplier information, historical records, warranty claims,
maintenance data, and laboratory testing.
Verify that the data represent the expected operating environment.
E. Select appropriate methods
Reliability Block Diagram: Evaluates system reliability from component
relationships.
Weibull analysis: Studies failure patterns and product lifetime.
FTA: Analyzes causes of critical system failures.
Life testing: Measures durability under normal conditions.
Accelerated life testing: Uses increased stress to produce failures more
quickly.
F. Calculate reliability measures Common measures include:
Reliability, R(t): Probability of operating without failure up to time t
Failure rate, λ: Frequency of failures
MTBF: Mean time between failures for repairable systems
MTTF: Mean time to failure for non-repairable products
Availability: Proportion of time the system is operational
G. Improve the design
Remove weak components and single points of failure.
Improve materials, tolerances, cooling, protection, or redundancy.
Simplify the design and improve maintainability.
H. Verify the improvements
Conduct reliability demonstration tests.
Compare the results with the targets and confidence requirements.
Update the analysis using test and field data.
I. Monitor performance
Track failures, repairs, warranty claims, and customer feedback.
Update the reliability model throughout the product life cycle.
For example, if a pump must operate for 10,000 hours with 95% reliability, testing and failure data are used to estimate whether it will achieve that target under its expected temperature, pressure, and load conditions.
8.Tolerance analysis

A tolerance analysis determines how variations in component dimensions affect the fit, function, and performance of an assembly.
A. Define the requirement
Identify the critical output, such as a gap, clearance, alignment, force, or
overall dimension.
Set acceptable upper and lower limits.
B. Create the dimension chain
Use drawings or CAD models to identify every dimension that affects the
critical output.
Include manufacturing, assembly, thermal, and material variations where
relevant.
C. Define nominal values and tolerances
Record each component's nominal dimension and tolerance.
Confirm that all tolerances use a consistent reference system and units.
D. Choose an analysis method
Worst-case analysis: Adds all tolerances in the most unfavorable
direction. It guarantees assembly if every part is within specification, but
may result in unnecessarily tight tolerances.
Root Sum Square (RSS): Uses statistical variation and assumes the
dimensions are independent and approximately normally distributed.
Monte Carlo simulation: Simulates many combinations and is useful for
nonlinear systems or non-normal distributions.
E. Calculate the result
For a linear dimension chain:
Y=A+B-C
The worst-case tolerance is:
T_Y=T_A+T_B+T_C
For independent statistical tolerances, RSS is:
T_Y=√(T_A^2+T_B^2+T_C^2 )
F. Compare with the requirement
Check whether the calculated variation stays within the functional limits.
Estimate the risk of interference, excessive clearance, or failure.
G. Improve the design
Adjust nominal dimensions.
Tighten only the tolerances that strongly affect performance.
Change the datum structure, manufacturing process, or assembly
method.
Add adjustability where appropriate.
H. Verify and document
Confirm the analysis using prototypes, measurements, or production
data.
Document assumptions, calculations, risks, and design decisions.
The goal is to achieve reliable assembly and performance without making tolerances unnecessarily tight or expensive.

9.Design for asambly
A DFA analysis evaluates a product design to make assembly simpler, faster, less expensive, and less prone to errors.
A. Define the scope
Select the product or assembly.
Establish targets for assembly time, cost, quality, and automation.
B. Map the assembly process
List every component and assembly step in sequence.
Observe the actual process when an existing product is available.
C.Evaluate each component
Ask whether the component must be separate because it:
Moves relative to other parts during operation
Requires a different material or isolation
Must remain separate for assembly, maintenance, or replacement
D. Reduce the number of parts
Integrate components where practical.
Remove unnecessary fasteners, washers, brackets, and adjustments.
Use snap-fits, tabs, or integral features when suitable.
E. Improve handling
Avoid parts that are very small, flexible, sharp, slippery, or easily
damaged.
Make parts symmetrical, or clearly asymmetrical, so their orientation is
obvious.
Prevent parts from tangling or nesting together.
F. Improve insertion and fastening
Provide chamfers, guides, alignment features, and adequate access.
Use self-locating and self-fastening parts.
Minimize fastening types, tools, and directions.
Design the assembly so components can be added from one direction.
G. Prevent assembly errors
Use poka-yoke features so incorrect installation is difficult or impossible.
Make orientation and component identification clear.
H. Measure the design
Estimate handling, insertion, fastening, and inspection time for every part.
Calculate total assembly time and cost.
Compare alternative concepts using a DFA score or efficiency measure.
I. Redesign and verify
Prioritize the largest time, cost, safety, and quality problems.
Build a prototype or conduct an assembly trial.
Confirm the improvement and update the work instructions.
A DFA analysis evaluates a product design to make assembly simpler, faster, less expensive, and less prone to errors.
The main DFA principles are: minimize part count, standardize components, simplify handling, reduce fastening, provide easy access, and prevent incorrect assembly.
10.Design for Afternarket
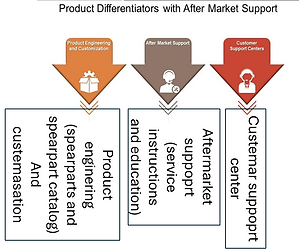
A Design for Aftermarket analysis ensures that a product is easy and cost-effective to service, repair, upgrade, and support after it has been sold.
A. Define aftermarket requirements
Set targets for product lifetime, service time, availability, repair cost, and spare-parts supply.
B. Study the product life cycle
Consider installation, operation, maintenance, repair, upgrades,
refurbishment, and disposal.
C. Identify service-critical components
Use reliability data, DFMEA, warranty claims, and customer feedback to
identify parts likely to fail or require maintenance.
D. Evaluate accessibility
Check whether technicians can reach and replace service parts safely
without removing unnecessary components.
E. Improve maintainability
Use modular designs, standard fasteners, clear labels, diagnostic
features, and replaceable wear parts.
Minimize the number of tools and service steps required.
F. Plan spare parts
Identify required spare parts and service kits.
Standardize components and ensure availability throughout the product's
supported lifetime.
G. Prepare service information
Create repair manuals, troubleshooting guides, parts lists, training
materials, and digital documentation.
H. Evaluate cost and logistics
Analyze repair-versus-replacement costs, inventory requirements,
packaging, transportation, and return flows.
I. Test service procedures
Conduct maintenance and repair trials with technicians.
Measure service time, safety, error risk, and first-time-fix rate.
J. Use field feedback
Monitor failures, returns, warranty costs, and customer complaints.
Feed lessons learned into product improvements and future designs.
The main objective is to improve serviceability and customer satisfaction while reducing downtime, repair costs, and warranty expenses.

11. Design for End of life analysis
A Design for End-of-Life analysis ensures that a product can be safely dismantled, reused, remanufactured, recycled, or disposed of when it is no longer needed.
A. Define the scope and targets
Set goals for reuse, recyclability, recovery, dismantling time, cost, and
legal compliance.
B. Map materials and components
Create a bill of materials.
Identify hazardous substances, valuable materials, batteries, electronics,
and reusable parts.
C. Select the best end-of-life route
Prioritize reuse, repair, refurbishment, remanufacturing, and recycling
before energy recovery or disposal.
D. Evaluate disassembly
Record the tools, time, steps, and skills required.
Identify components that are difficult or unsafe to remove.
E. Improve the design
Reduce the number of materials and avoid inseparable material
combinations.
Use standard, reversible fasteners instead of permanent adhesives or
welds where appropriate.
Make batteries and hazardous parts easy to remove.
Use modular and replaceable components.
F. Improve material identification
Clearly label plastics, alloys, batteries, and hazardous materials.
Provide dismantling and recycling instructions.
G. Assess environmental impact
Use life-cycle assessment to compare disposal, recycling,
remanufacturing, and reuse options.
H. Evaluate logistics and economics
Consider collection, transportation, sorting, labour, recovery value, and
recycling costs.
I. Test the process
Conduct a dismantling trial and measure time, safety, material recovery,
and contamination
J. Document and improve
Record the selected recovery routes and design requirements.
Update the analysis when materials, regulations, or recycling
technologies change. The main objective is to minimize waste and
environmental impact while maximizing the recovery of components and
materials.
I repeat: the design quality tools are:
1.Design Risk Analysis
2.Quality Function Deployment (QFD)
3.Design Failure Mode and Effects Analysis (DFMEA)
4.Design for Six Sigma (DFSS)
5.Design of Experiments (DOE)
6.Fault Tree Analysis (FTA)
7.Reliability analysis
8.Tolerance analysis
9.Design for asambly
10.Design for Afternarket
11.Design for Scrapping
Presentation of Leadership. The corresponding PPP is for sale. The development of targets is explained
Reference
Menues


Main Menu
Building Block Menu

Training Menu


Assessment Menu
Company Philosophy Menu
Coaching Menu


Workshop Menu

SPOTLIGHT / Focus on Heart and Mind menu


A Human Centered Organisation
Core Human Values
Moral Ambition


