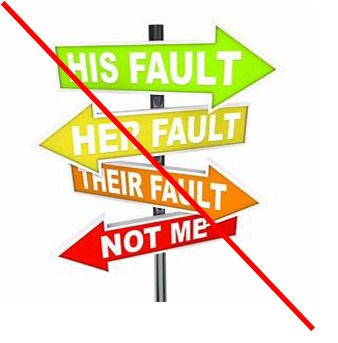
Production Quality Tools


We use quality tools to understand and prevent problems and to improve products, services, and processes.
They help us:
- Collect reliable data instead of guessing.
- Identify the most important problems.
- Find the root causes of defects and mistakes.
- Measure variation in a process.
- Choose and test solutions.
- Monitor results to ensure improvements continue.
- Reduce waste, costs, and defects.
- Increase customer satisfaction.


The Production 7 Quality Tools
1.Check sheet - collects and counts data.
2.Flowchart - shows the steps in a process.
3.Pareto chart - ranks problems from most to least important.
4.Cause-and-effect diagram - identifies possible causes of a
problem; also called a fishbone or Ishikawa diagram.
5.Histogram - shows the distribution and variation of numerical
data.
6.Control chart - monitors whether a process is stable over time.
7.Scatter diagram - shows the relationship between two
variables.
Other widely used methods include 5 Whys, 5S, FMEA, SPC, process mapping, benchmarking, and PDCA.


1. Check sheet
A check sheet is used to collect data and record results in a simple, organized way.
Example:
The results show how often each problem occurred. You can use them to identify the most common problem and decide what to improve first.
2. Flowchart
A flowchart uses:
Oval - start or end
Rectangle - an action or process
Diamond - a decision
Arrows - direction of the process


3. Pareto chart
A Pareto chart is a bar chart that ranks problems from the most frequent to the least frequent. It helps identify which problems should be solved first.
It follows the 80/20 principle: often, about 80% of problems come from 20% of the causes.
4.Cause-and-effect diagram
(Fishbone or Ishikawa)
A way to analyse root causes is the Fish bone analysis (Ishikewa diagram analysis), where you start with the problem and work your way back through different possible causes of the problem

Categories to consider in the analysis
- Machine (equipment, technology)
- Method (process)
- Man/Mind(physical or knowledge)
- Measurement (inspections)
- Management /money power (leadership)
- Maintenance
- Product/Service
- Price
- Promotion(Marketing)
- Process (System)
- People (Personal)
- Physical evidence
- Performance
- Surroundings (Environment)
- Suppliers
- Skills
5.Histogram
A histogram shows how numerical data is distributed.
Choose what to measure, such as product weight.
Collect many measurements.
Find the lowest and highest values.
Divide the values into equal ranges, called bins.
Count how many measurements fall into each bin.
Draw bars: ranges on the horizontal axis and frequency on the vertical axis.
Study the shape to identify the centre, spread, unusual values, or multiple peaks.

6. Control chart
1. Choose what to measure, such as product weight, size, temperature, or
number of defects.
2. Collect measurements regularly and in the same way.
3. Plot the results in time order.
4. Calculate the centre line, usually the average.
5. Calculate the upper control limit (UCL) and lower control limit (LCL).
6. Look for warning signs:
- A point outside the control limits
- Many points continuously rising or falling
- Several points on the same side of the centre line
- Unusual patterns
7.Investigate the cause, correct it, and continue monitoring.
The control limits show normal process variation. They are not the same as customer specification limits. A stable process can still produce unacceptable products if it does not meet customer requirements

7. Scatter
A scatter diagram shows whether two variables are related.
1. Choose two variables, such as machine speed and number of
defects.
2. Collect paired measurements at the same time.
3. Put one variable on the horizontal X-axis.
4. Put the other variable on the vertical Y-axis.
5. Plot each pair as one point.
6. Examine the pattern:
- Points rising from left to right: positive relationship
- Points falling from left to right: negative relationship
- Points with no clear pattern: little or no relationship
- One distant point: possible outlier
For example, if defects increase as machine speed increases, the diagram suggests a positive relationship. However, correlation does not prove that one variable causes the other.

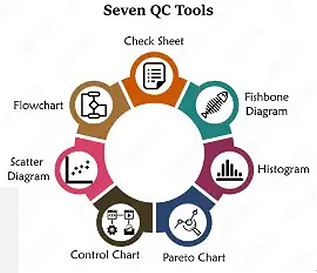
I repeat: the Production quality tools are:
1.Check sheet
2.Flowchart
3.Pareto chart
4.Cause-and-effect diagram
5.Histogram
6.Control chart
7.Scatter diagram
Other widely used methods include 5 Whys, 5S, FMEA, SPC, process mapping, benchmarking, and PDCA.
Presentation of Leadership. The corresponding PPP is for sale. The development of targets is explained
Menues


Main Menu
Building Block Menu

Training Menu


Assessment Menu
Company Philosophy Menu
Coaching Menu


Workshop Menu

SPOTLIGHT / Focus on Heart and Mind menu


A Human Centered Organisation
Core Human Values
Moral Ambition